Your AI application is lagging, users are complaining, but your cloud dashboard says everything is fine. Your CPU usage is hovering at a comfortable 20 percent while your inference requests are timing out.
This is the classic scaling trap for AI engineers. Traditional auto-scaling is built for web servers where CPU and memory are the primary bottlenecks. In the world of large language models and vector databases, those metrics are practically useless.
If you wait for your CPU to hit 80 percent before spinning up a new pod, your service will be dead in the water long before the second instance even starts its boot sequence. GPU-bound workloads require a completely different playbook.
To build a resilient, cost-effective AI SaaS, you need to move beyond reactive hardware metrics. You need to scale on intent, queue pressure, and the specific physics of GPU memory.
Why the CPU lie is killing your UX
Most horizontal pod autoscalers (HPA) are configured to watch CPU utilization by default. For a Laravel or Node.js API, this works great. The work is linear — more requests equal more CPU cycles.
AI models are different. The CPU handles the “boring” stuff like tokenization, request routing, and managing HTTP headers. The heavy lifting happens on the GPU.
I have seen production clusters where the GPU is pinned at 100 percent while the CPU sits idle. Kubernetes sees the low CPU usage and thinks the pod is healthy. It might even try to pack more pods onto that node, leading to a catastrophic failure.
GPU utilization vs occupancy: the hardware layer
When you finally switch to monitoring GPUs, you encounter two confusing metrics: utilization and occupancy.
GPU utilization is essentially a duty cycle. It tells you the percentage of time the GPU was active over a sample period. It is a lagging indicator. By the time it hits 90 percent, your request queue has likely been building for 30 seconds.
Occupancy is more granular. It measures how many “warps” or hardware slots are filled within the streaming multiprocessors (SM). You can have high utilization but low occupancy if your batch size is too small.
For scaling, utilization is the baseline, but it isn’t the truth. You need to look at what is happening before the request even hits the silicon.
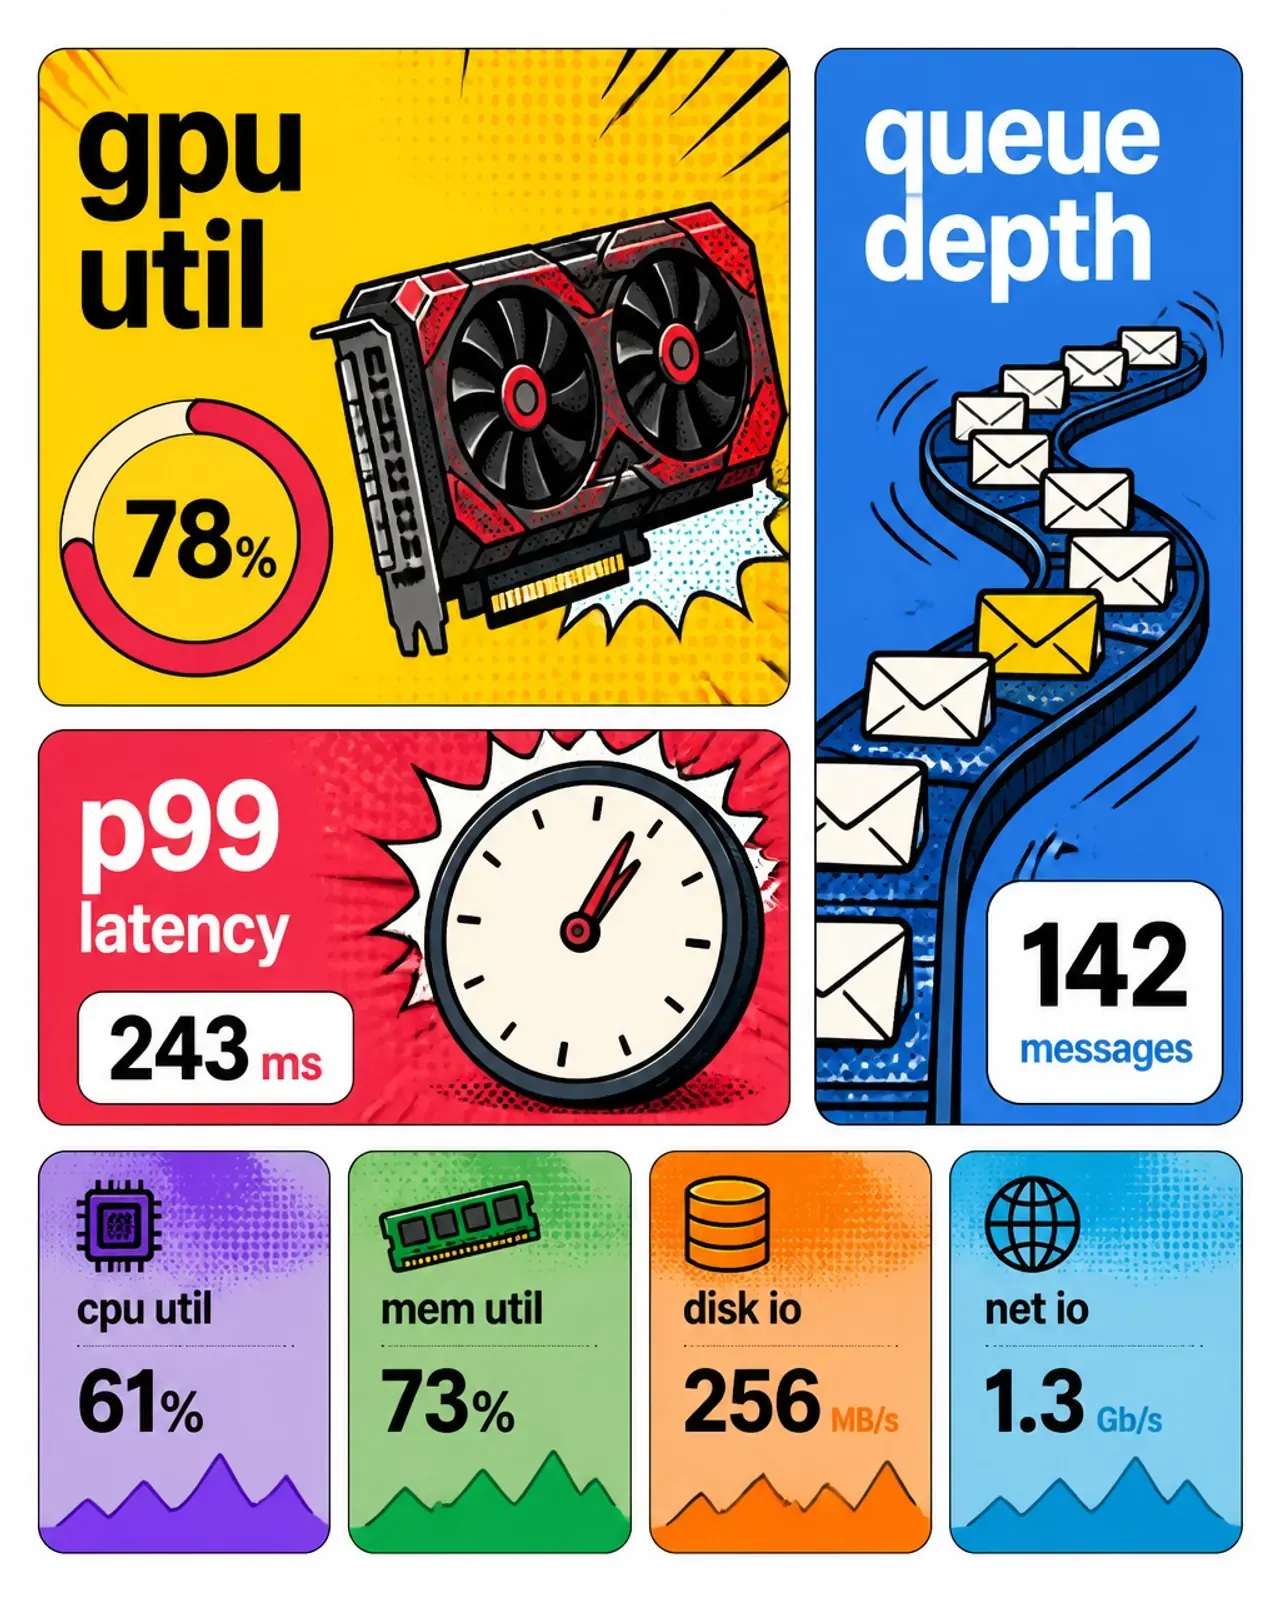
Queue depth: your best leading indicator
If you want to stop fires before they start, monitor your queue depth. In vLLM or SGLang, this is the number of requests waiting for a slot in the inference engine.
Queue depth is a direct predictor of latency. If you know your model can handle 16 concurrent requests before P99 latency starts to climb, set your scaling trigger at 12.
Scaling on queue depth lets you provision capacity while the current hardware is still performing within SLO. It gives you that 60-second head start you need to pull a fresh container and load a 20GB model weights file into memory.
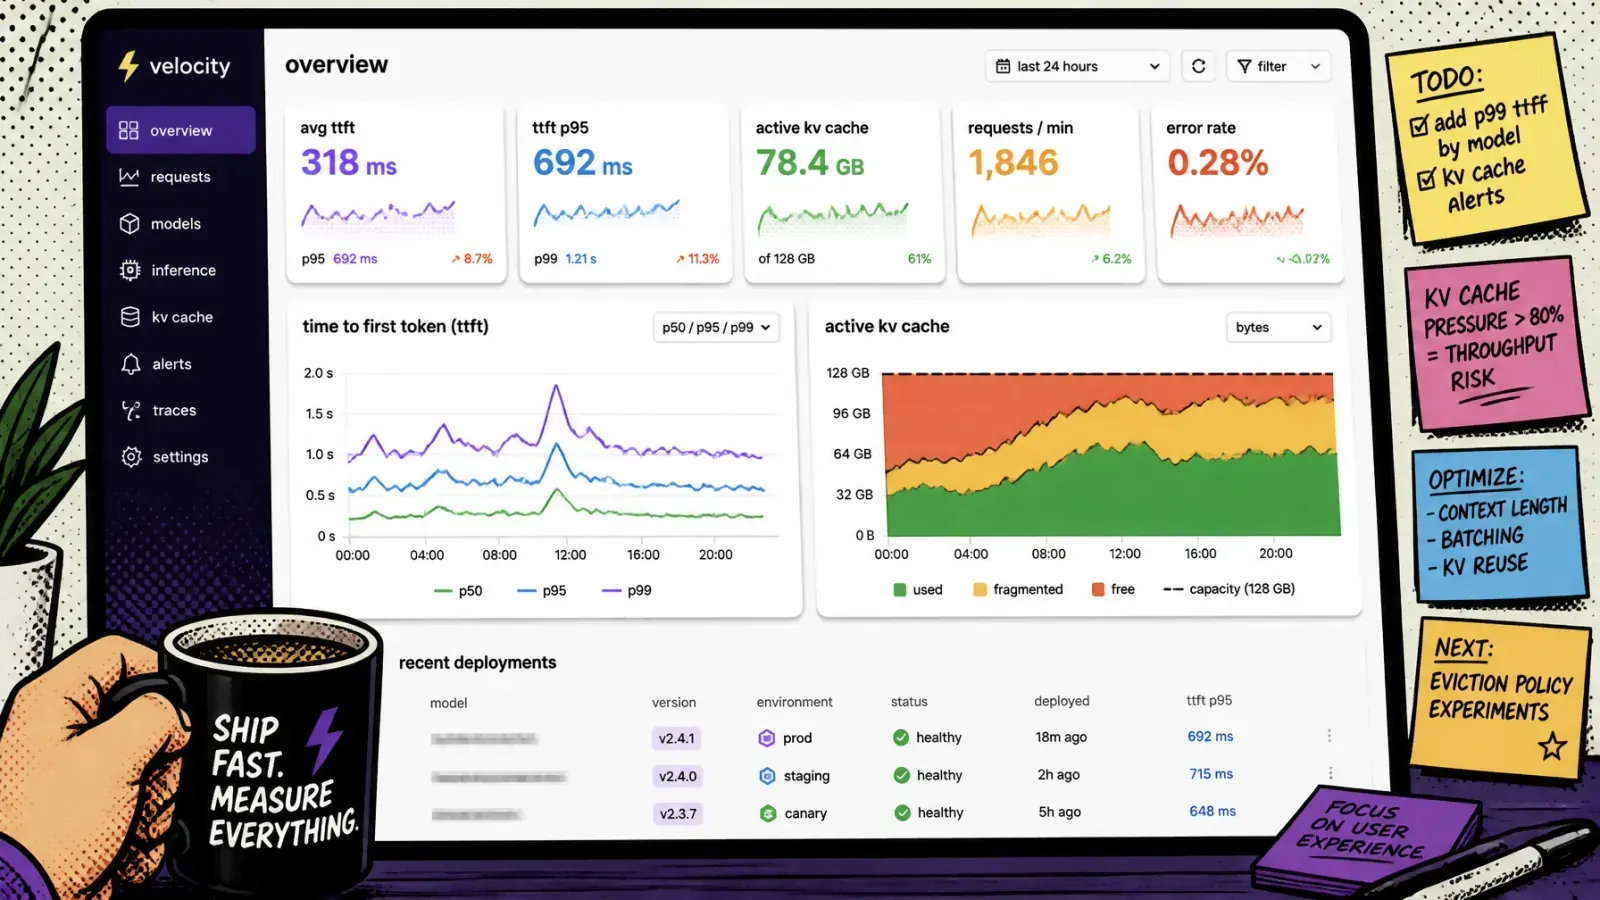
Token velocity and the KV cache
In generative AI, not all requests are created equal. A 10-token summary request is light. A 4,000-token RAG retrieval analysis is a heavyweight.
This is where token velocity and KV-cache usage come in. The KV cache is the memory on the GPU that stores the context of current conversations. If your KV cache is 95 percent full, the next long request will trigger an eviction or a “swap to CPU” event.
Latency will skyrocket. Your P99 will look like a mountain range.
I recommend scaling based on a combination of:
- Token velocity — total tokens per second across all active instances.
- KV-cache pressure — the percentage of available cache blocks currently occupied.
When the cache is full, it doesn’t matter how low your GPU utilization is. You cannot fit more work onto that chip. You must scale.
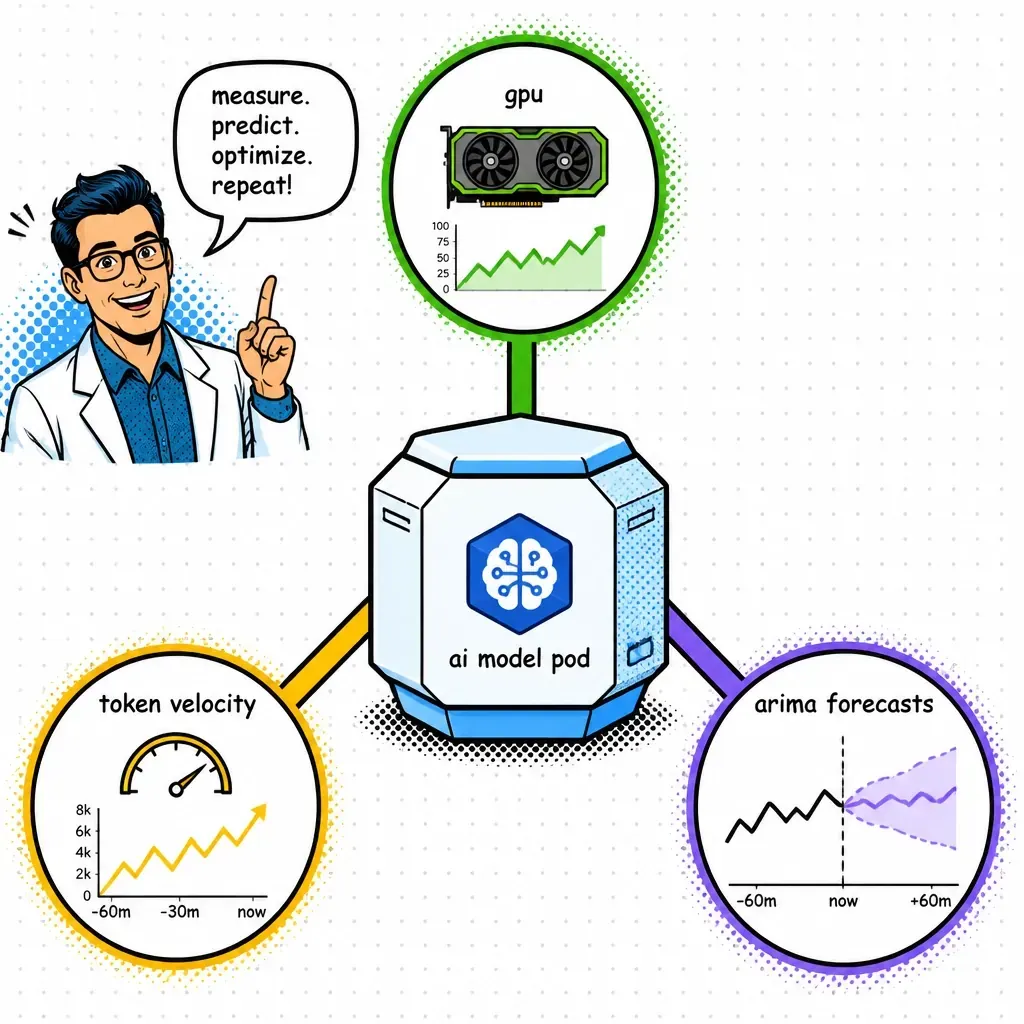
Predictive scaling with ARIMA
Reactive scaling is always playing catch-up. Even with fast boot times, there is a delay. For enterprise apps with predictable traffic patterns, I use ARIMA (Auto-Regressive Integrated Moving Average) models to forecast load.
If I know traffic historically spikes at 9:00 am every Monday, I don’t wait for the queue to grow. I use a time-series forecast to spin up the “base load” pods at 8:55 am.
This turns your infrastructure into a proactive system rather than a reactive one. You pay for what you use, but you ensure the capacity is there before the first user clicks “Generate.”
Practical steps for your stack
Implementing this doesn’t have to be a nightmare. Here is how I structure it:
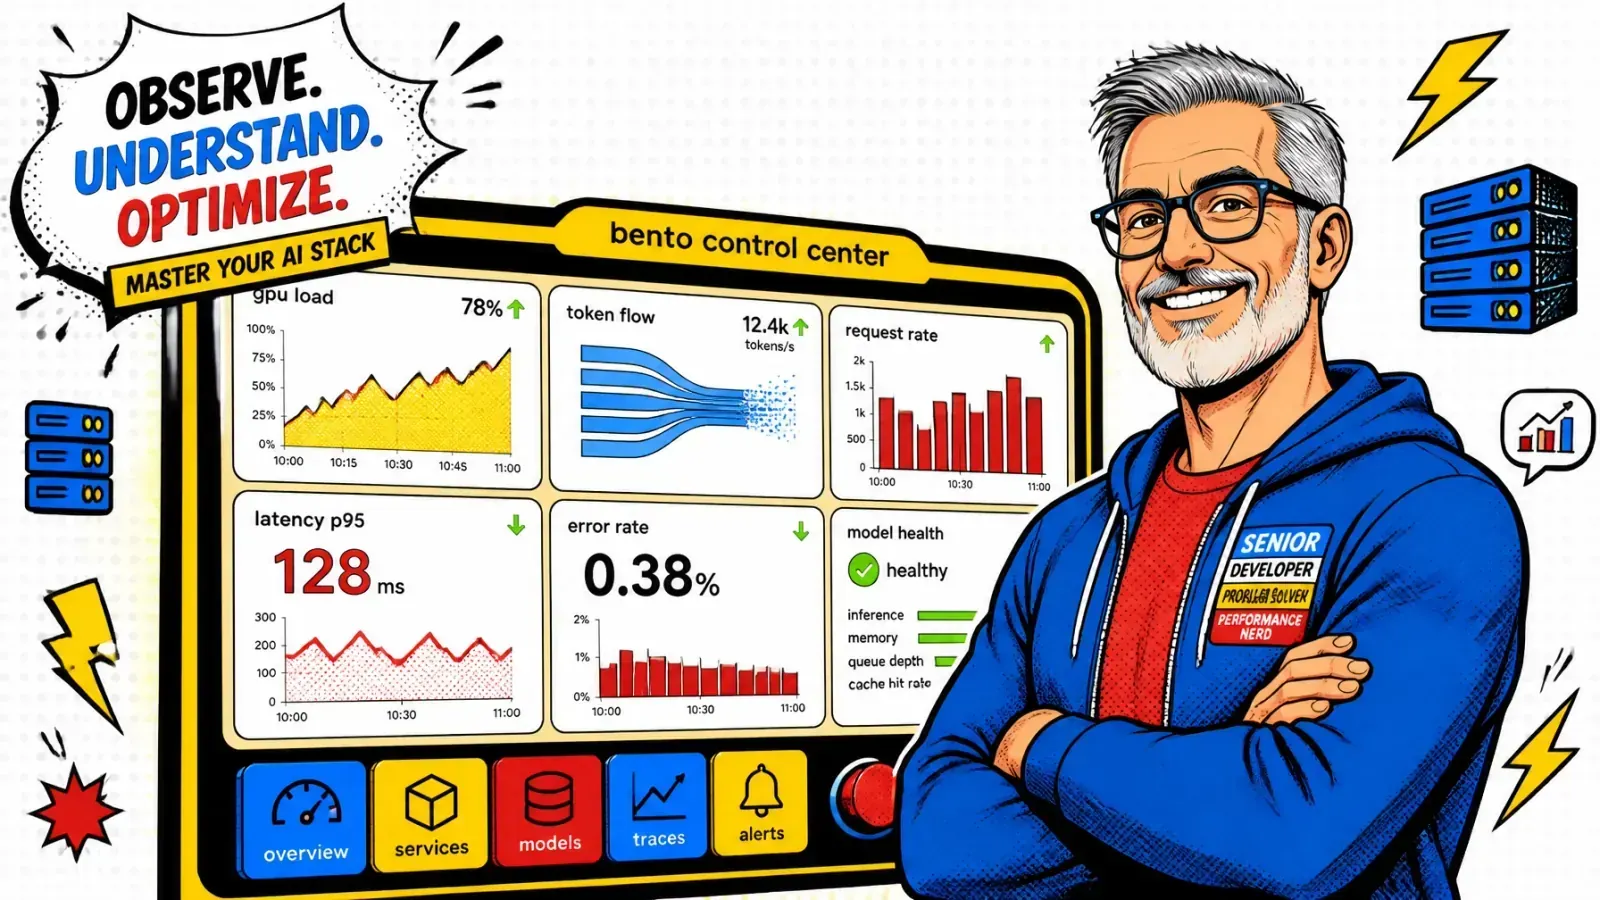
- Use KEDA — the Kubernetes Event-Driven Autoscaler is the gold standard. It lets you scale based on Prometheus metrics like queue depth or P99 latency instead of just CPU.
- Set TTFT SLOs — measure time-to-first-token (TTFT). This is the most critical metric for user perception. If TTFT P99 exceeds 500ms, you need more replicas.
- Blur the lines — don’t rely on a single metric. Create a composite score of GPU utilization, queue depth, and cache pressure.
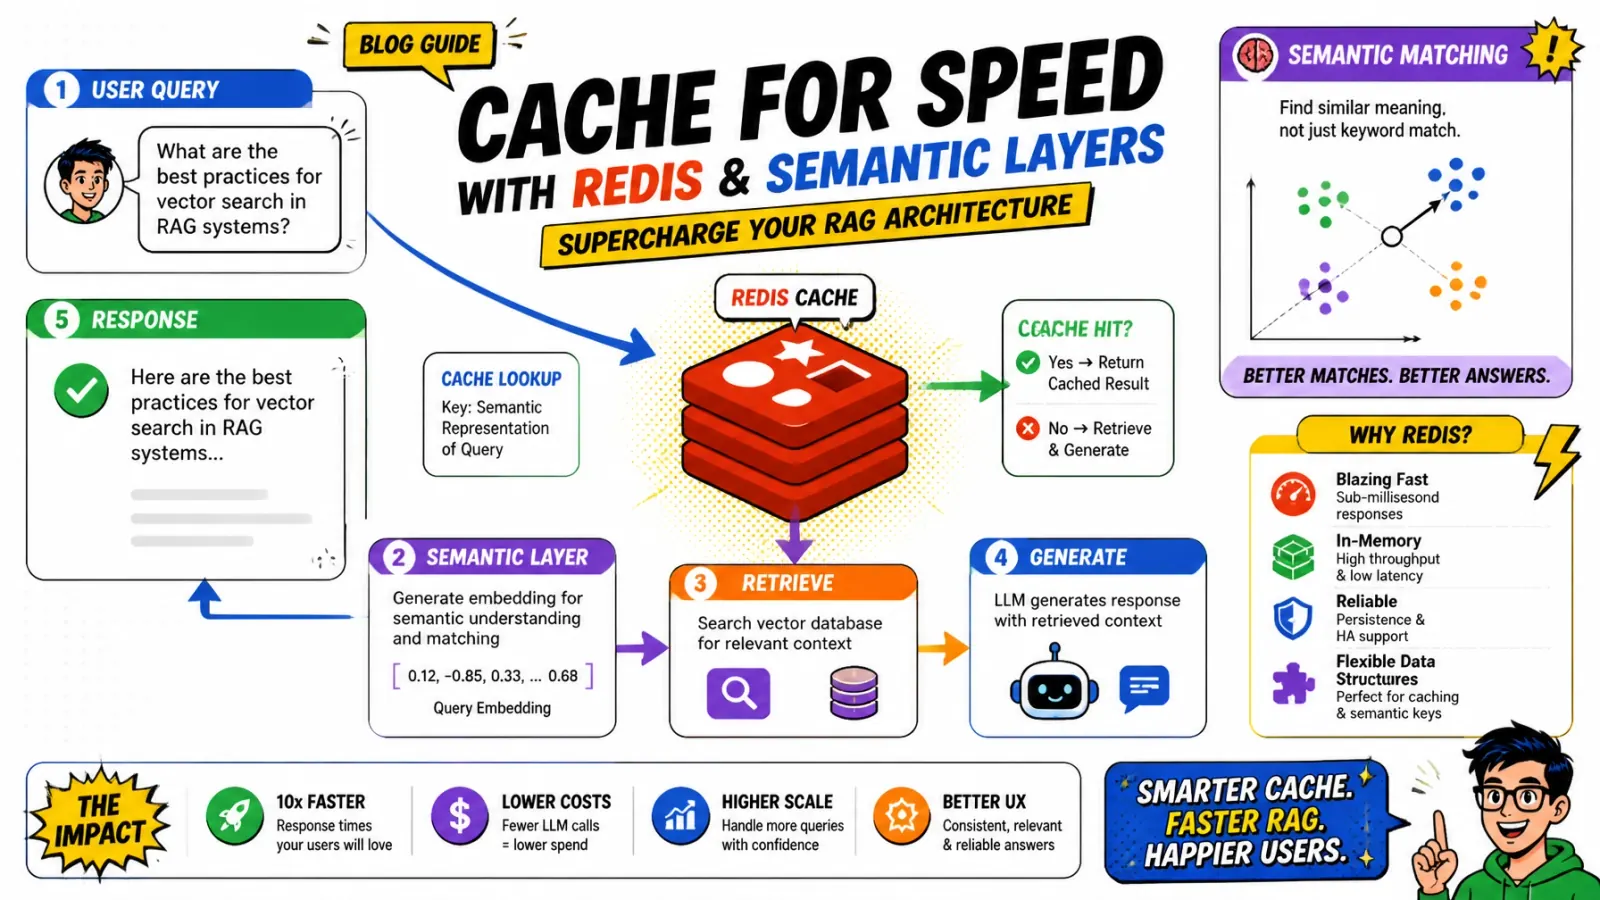
- Fix your RAG — sometimes the scaling issue is actually a retrieval issue. If your vector search is slow, the inference engine waits longer, hogging the GPU. Check out these common RAG mistakes to ensure your bottleneck isn’t upstream.
- Optimize the frontend — for Shopify apps or custom SaaS, ensure your agentic workflows handle retries gracefully when the infrastructure is scaling up.
Scaling AI isn’t about having the biggest GPUs. It is about having the smartest triggers. By moving to service-level metrics, you save money on idle compute and save your users from the dreaded “thinking…” spinner.
Are you still scaling on CPU, or have you made the jump to queue-based triggers yet? Drop a note via contact — I love this conversation. 🤘